Visualization
Overview
Data visualization is the process of transforming data into visual representations. It's a way to communicate information clearly and effectively.
In a pervious module, we talked about how data visualization aids in the exploratory data analysis process. and how relying on statistics alone can be misleading. In this module, we'll learn how to choose the right visualization for the right data, how to use visualizations to communicate our findings.
We will use different libraries to create visualizations. We will use matplotlib and seaborn to create static visualizations. We will use plotly to create interactive visualizations. We will use folium to create interactive maps.
Links to the libraries:
Motivation
- There's a distinction between Exploratory vs Explanatory Data Analysis:
- Exploratory: We're trying to understand the data, find patterns, and relationships.
- You try different visualizations and extract different insights from each one.
- Explanatory: We're trying to communicate our findings to others.
- Exploratory: We're trying to understand the data, find patterns, and relationships.
- In your data analytics work, we will be doing both.
- It is of crucial importance to choose the right visualization for the right data.
Choosing the right visualization
- There are many different types of visualizations.
- Depending on the data we have and the question we're trying to answer, we will need to choose a different visualization.
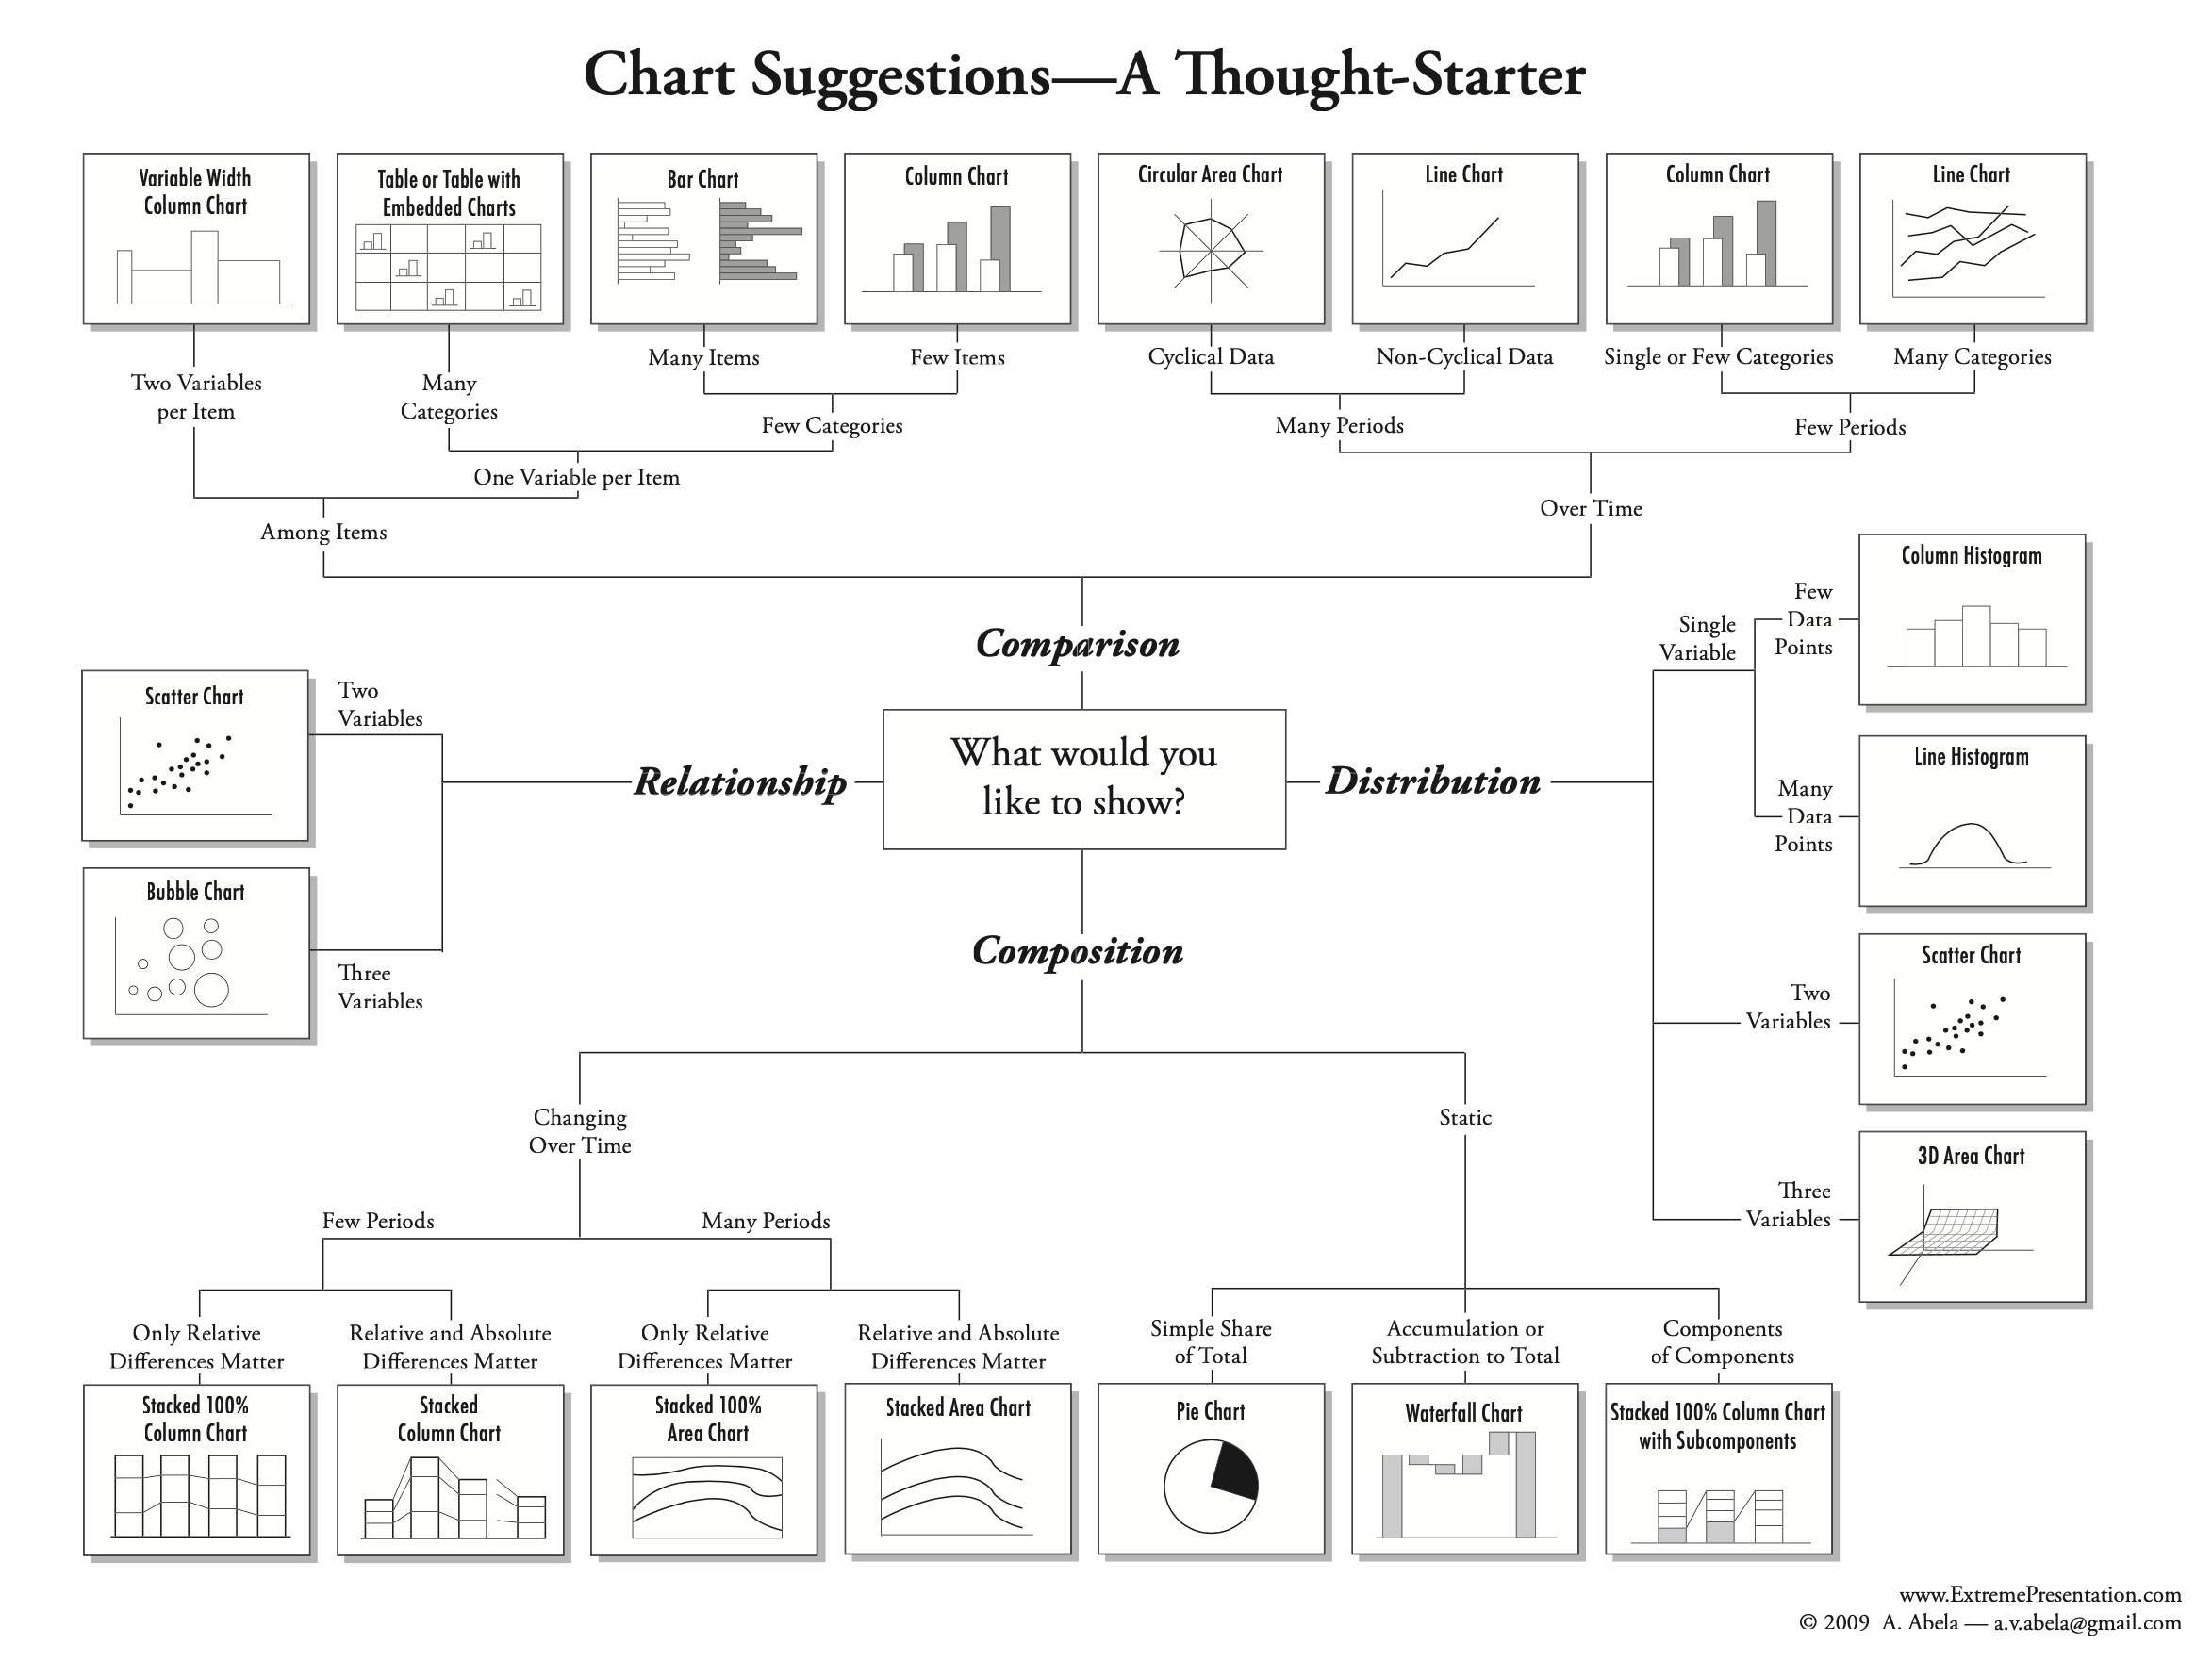
- We can break down the charting message types into multiple types:
- Comparison charts
- Composition charts
- Distribution charts
- Relationship charts
The following is a thought starter to choose a diagram for your data

The best way to learn about this, is by practice. Not videos or tutorials. Practice. Practice. Practice.
In addition to this week's assignment on visualizing data, I recommend you to go through the following resources:
- The following Visual Reference is a great resource to help you choose a visualization.
- Also, this is is a great resource to help you choose a visualization.