Data Analytics
What is data analytics and why is it important?
- Data is the new Oil.
- Data Analytics is the refining process of the new Oil, to produce a much more valuable forms of Oil (insights).
- Examples for Data Analytics and Science driving change:
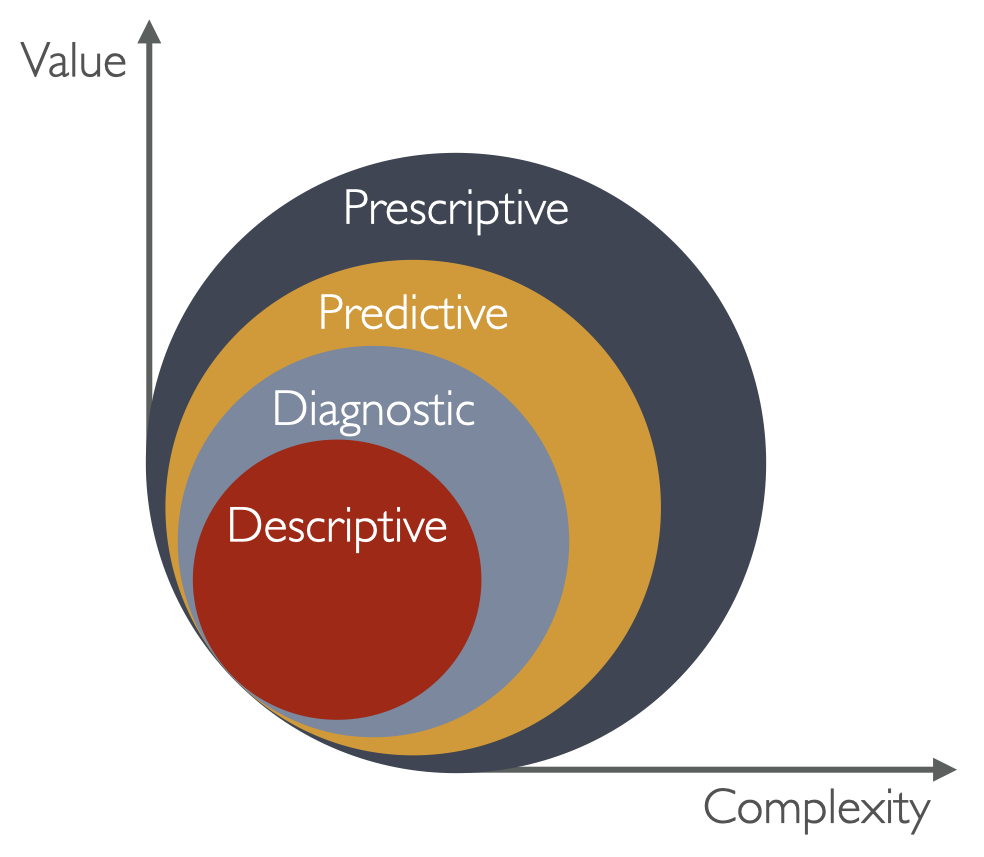
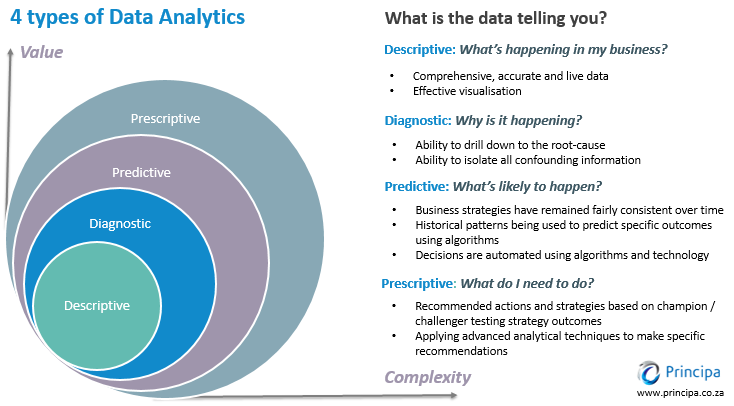
Types of Data Analytics

- Descriptive analytics
- Diagnostic analytics
- Predictive analytics
- And prescriptive analytics
Data analytics process

- Ask
- Understanding the business needs
- asking the relevant questions
- defining the objectives of the project and the needs that are being tackled
- Prepare
- collecting the data from the available data sources
- Process
- Data cleaning
- data reduction
- data transformation
- fixing inconsistencies and anomolies
- handeling missing data
- If this is a machine learning analytics, project this step may include some more steps such as feature engineering, data normalization, …
- Analyze
- Exploratory data analysis
- All trypes of analysis analysis
- Share
- Storytelling with Visualizations
- Act
- This is where the stakeholder could take information and start making decisions,
- request further analysis
- identify KPM and monitoring procedures and so on.

flowchart LR
A[0. Ask] --> B[1. Prepare] --> C[3. Process] --> D[4. Analyze] --> E[5. Share] --> F[6. Act]
flowchart TD
%% STYLES %%
%% NODES %%
A[Start]
env(Setting up the Environment)
svc(Source Version Control - git)
in-python(Installing Python)
python(Basics of Python)
data-sources[(Working with Data Sources)]
style data-sources fill: #f95
F(Files)
G(Relational Databases)
H(non-Relational Databases)
I(REST API)
correlate{{Correlating Data}}
K(Apply Basics of Statistics)
viz(Visualizing Data)
style viz fill:#f9f,stroke:#333,stroke-width:4px
graphtypes[Graph Types]
N[Pie]
O[Bar]
P[Chart 3]
story(Telling the Story of Data)
%% SUB GRAPHS %%
subgraph ENV [Environment Setup]
direction LR
svc --> in-python --> python
end
subgraph DATA-SOURCES [Data Sources]
direction LR
F --> G --> H --> I
end
subgraph CHARTS [Chart Types]
direction LR
N --> O --> P
end
%% DIAGRAM %%
A --> env
env --> ENV
ENV --> data-sources
data-sources --> DATA-SOURCES
DATA-SOURCES --> correlate
correlate --> K
K --> viz
viz --> graphtypes
graphtypes --> CHARTS
CHARTS --> story
flowchart TB
START --> A[1. Capture] --> B[2. Process] --> C[3. Store] --> D[4. Analyze] --> E[5. Use] --> END
style START fill: #f95
style END fill: #f95
A --> CAPTURE
subgraph CAPTURE [Data Ingestion]
direction TB
A1[Cloud pub/sub]
A2[Data Transfer Service]
A3[Storage Transfer Service]
A1 --> A2 --> A3
end
B --> PROCESS
subgraph PROCESS[Streaming and Data Pipelines]
direction TB
B1[Cloud Data flow - Stream and Batch Processing]
B2[Cloud Data Proc - Hadoop + Spark]
B3[Data Prep]
B1 --> B2 --> B3
end
C --> STORE
subgraph STORE [Data Lake and Data warehousing]
direction TB
C1[Cloud Storage]
C2[Big Query Storage]
C1 --> C2
end
D --> ANALYZE
subgraph ANALYZE [Data Warehousing]
direction TB
D1[Big Query]
D2[Data Visualization]
D1 --> D2
end
E --> USE
subgraph USE [Advanced Analytics]
direction TB
E1[TensorFlow]
end